#CILIPSGoGreen x National Library of Scotland
Category: Blog, CILIPSGoGreen
![]()
From now until November when COP26 arrives in Glasgow, CILIPS will be sharing videos, links, recommended readings and much more for members who want to grow their organisation’s environmental consciousness – recognising the key role that libraries can play in inspiring their communities to take vital climate action.
In this interview, Chris Fleet and Louise Speller from the National Library of Scotland reveal how the Library’s extensive Map Collection can be used to research the reality of climate change, sharing their insights into what libraries can do to promote sustainability in Scotland and beyond.
Images throughout with thanks to the National Library of Scotland.
Can you tell us a little bit about Map Images and what inspired the NLS team to use your map collection to illustrate climate change?
Chris: The COP26 Climate Conference in Glasgow provided the impetus for a number of related activities in the NLS relevant to climate change. This has included the development of a Climate Change Action Plan, as well as various initiatives related to the collections encouraged by a Climate Crisis intern Henry Roberts. Our new maps page on Researching climate change with our maps website formed part of this wider initiative.
Louise: The Map Images is only a small sample of the overall diverse Map Collections. We hold maps at different scales, showing different places and covering a range of themes. Maps are a very visual medium, and an image of a map can demonstrate the effects of climate change instantly; in a way that most text simply can’t. We want to help readers who are researching climate change by providing examples. Some of these examples show collaborative projects that the National Library of Scotland has been involved with. Other examples were suggested by colleagues.
Were the results of the research what you expected? Did any of the findings shock or surprise you?
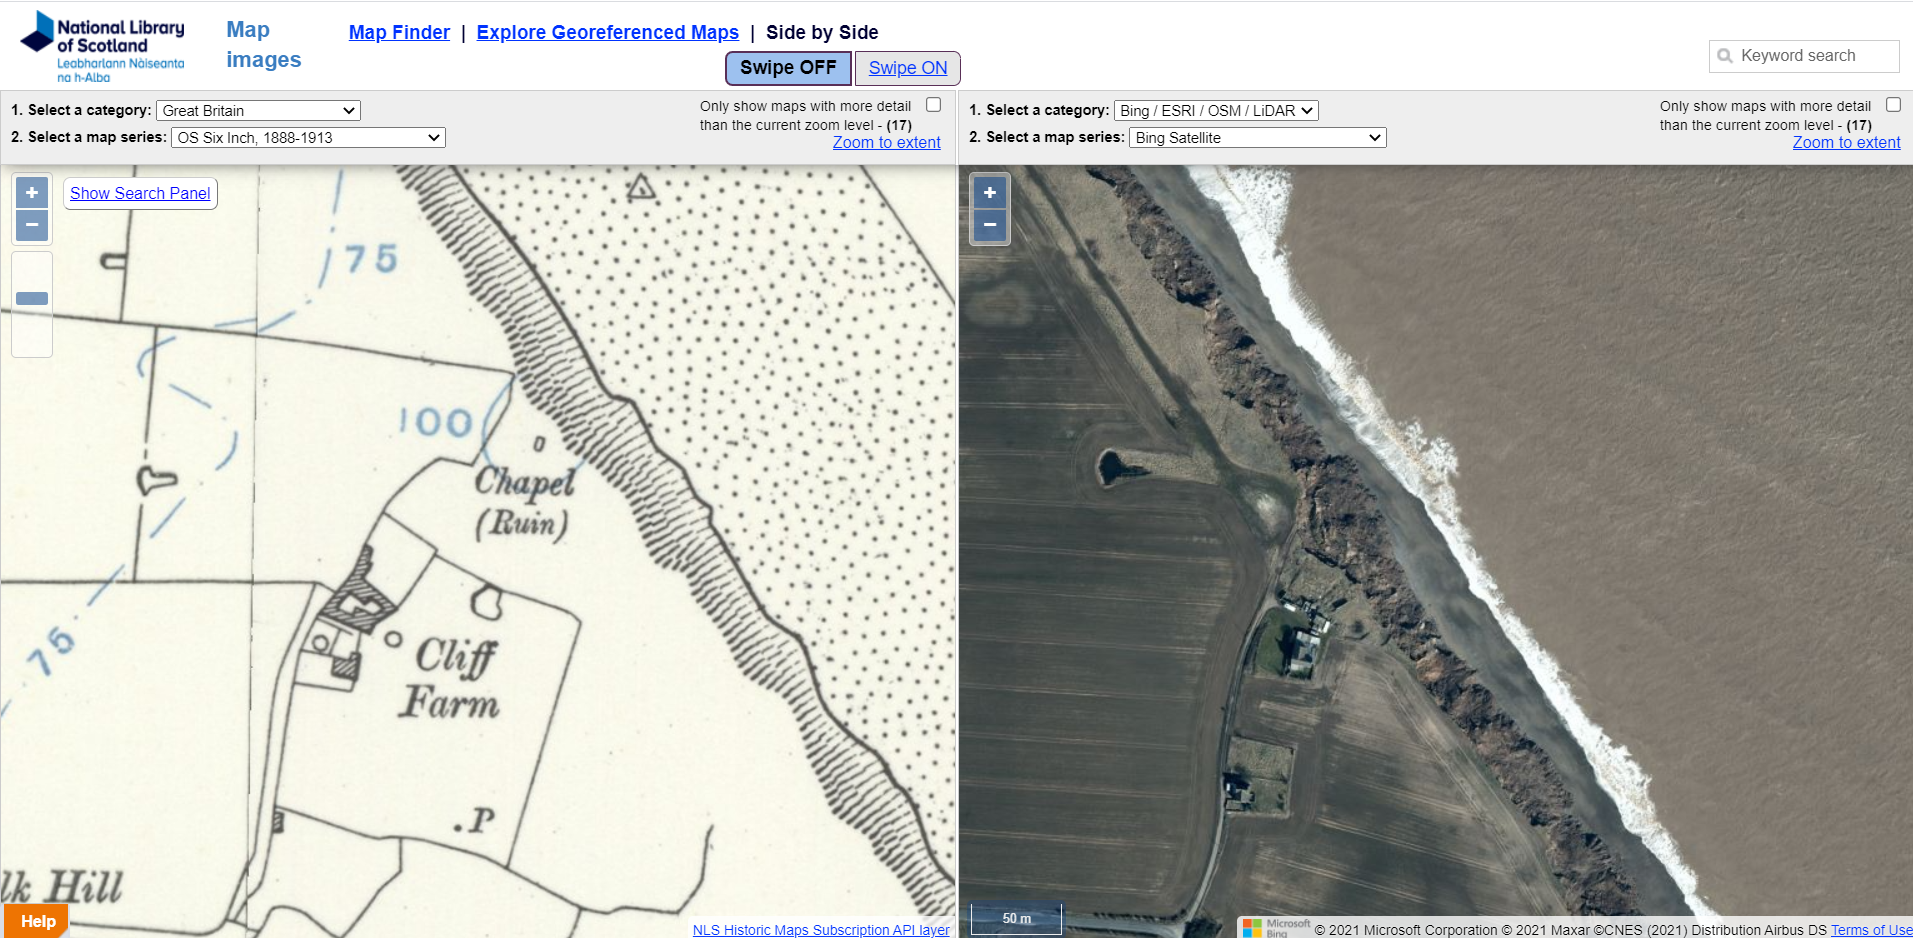
Louise: Most of the examples did show the results that we expected. Some were surprising. Personally, the most shocking finding was the extent of coastal erosion along the east coast of Yorkshire – to the extent that an entire village has been lost. Seeing this change being visually represented on a map really brings home how much of the coast has disappeared.
Chris: It was interesting to discover how many examples could be found relating to local climate change in Scotland, as well as historic examples too. The predominant simple impression of climate change through the media can encourage the view that it is far away or remote, rather than something that can be seen locally. For copyright reasons, we are not permitted to put online many maps published in the last 50-70 years, and the initial impression we had was that these would be of most interest for showing climate change, but in fact, there were many examples which could be found from longer ago too.
The extent of erosion along the east coast of Yorkshire, illustrating the loss of an entire village.
When designing the ‘Researching Climate Change’ page of the Maps Website, how important was it that the public were able to interact with the maps virtually and ‘see for themselves’ the impact of changes?
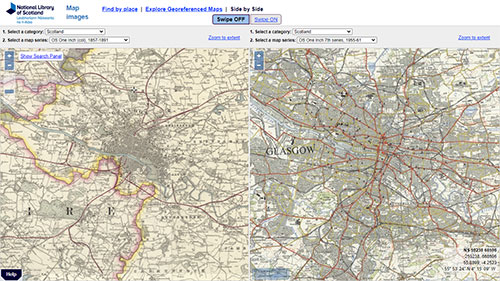
Louise: We are keen for the public to interact with the maps and even play around with the different functions to really get a feel for how things have changed due to Climate Change. Each image links back to the website so readers can really see for themselves what the maps show. We also wanted to show how the Maps Website provides a platform to compare historic and current maps simultaneously using either the Side-by-Side Viewer, our Georeferenced Viewer or the Spyglass Viewer.
Chris: The page is intended to be a springboard for users to look at their own places of interest, and interact with other maps. As our georeferenced maps cover wide areas, such as the United Kingdom, the hope is very much that users will be inspired by the case studies and examples to look at their own places of interest and explore other maps too.
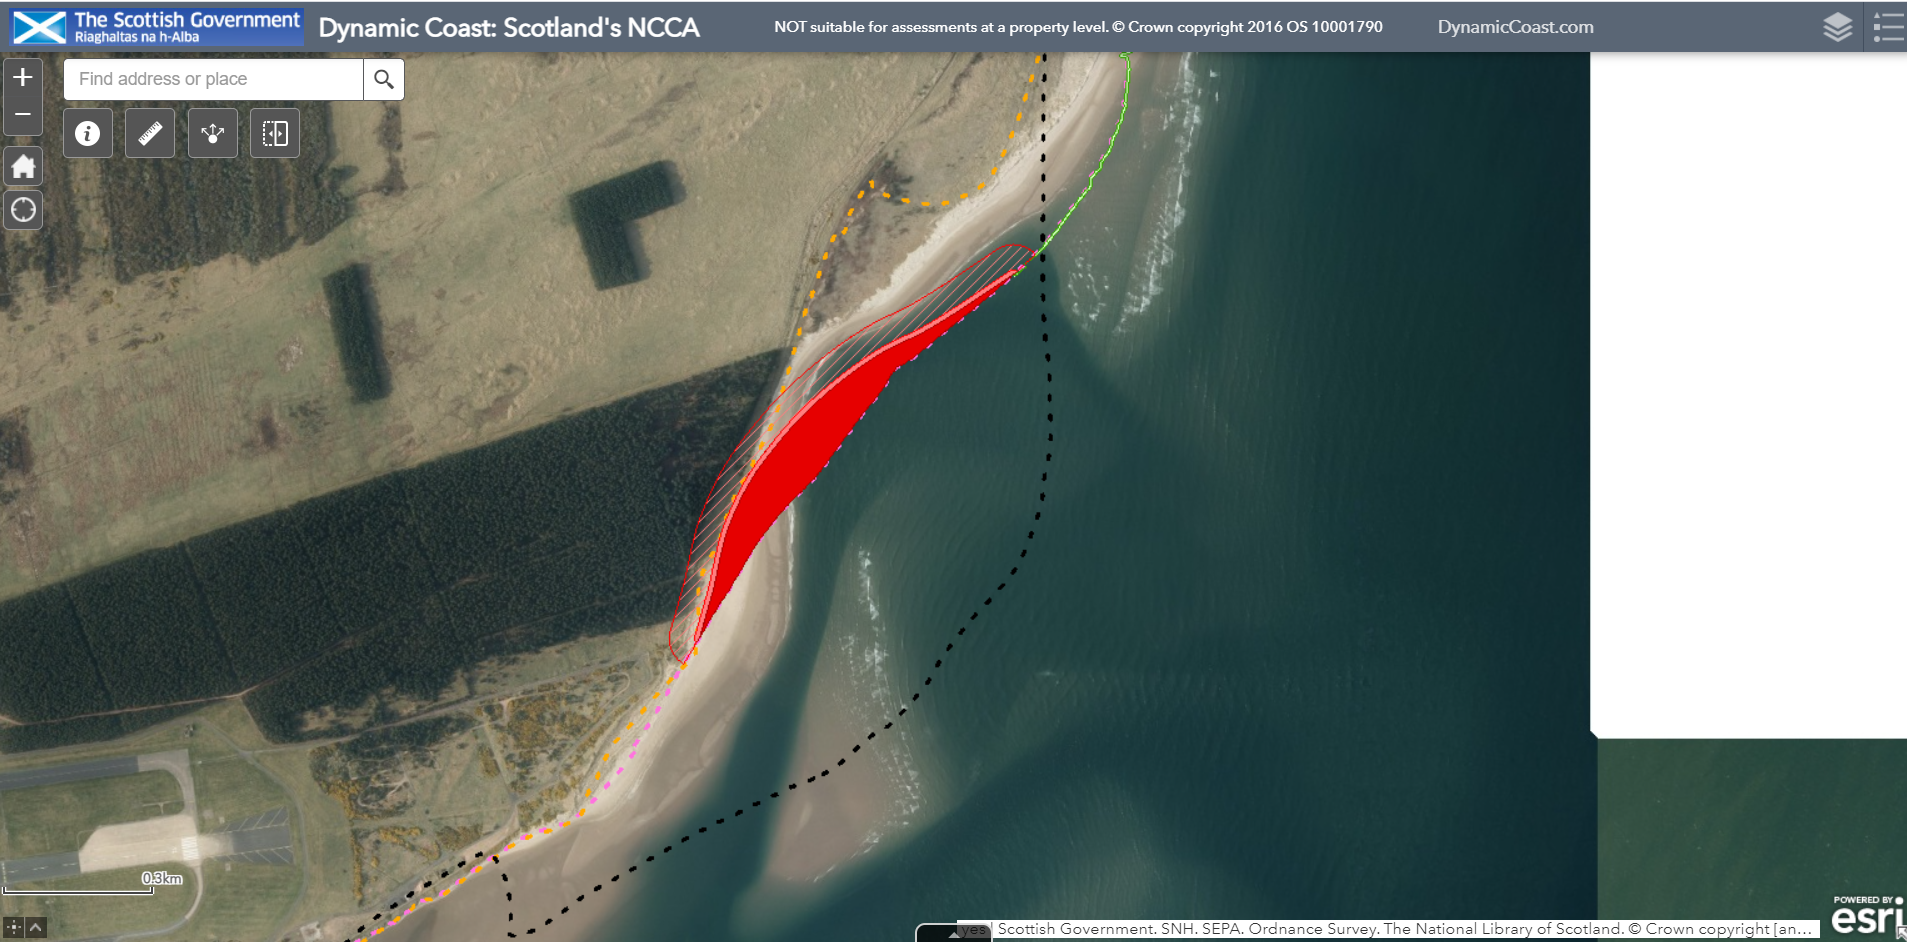
Can you tell us about the library’s contribution to the Dynamic Coast project and how your collections are supporting it?
Chris: Our contribution to the Dynamic Coast project was to provide access to detailed historic Ordnance Survey georeferenced maps for Scotland dating from the 1890s. These allowed the sea level, recorded as the Mean High Water Spring line, to be traced in the 1890s and then compared to sea levels in the 1970s and the present day. This was the first time this kind of detailed assessment of coastal change had been undertaken comprehensively around the Scottish coastline, and it enabled many important conclusions to be made.
For example, the soft coastline (coasts with the potential to erode) makes up 19% (3,802 km) of the Scottish coast, but between a half and a third of all coastal buildings, roads, rail and water networks lie in these erodible sections. Since the 1970s, 865 km of the soft coastline has moved position: 11% (423 km) has advanced (accreted); 12% (442 km) has retreated (eroded); and the remaining 77% (2,936 km) has remained approximately stable. Compared with the time period from 1890 to 1970, the proportion of advancing coast has fallen by 22%, and since the 1970s, the proportion of retreating coast has increased by 39%. The Dynamic Coast project also used these rates of historic change to forecast future coastal changes to 2050, which will have major adverse impacts on specific sites unless mitigating action is taken.
The Water to Steam research project seems especially intriguing in how it examines the social and economic forces that often exacerbate climate change, as well as how progress in environmental consciousness is not always linear. Does the evidence you’ve uncovered through the use of NLS’s map collection suggest an optimistic or pessimistic future for Scotland?
Chris: The Water to Steam project is still underway and so our findings so far are still provisional, but it has been a very interesting research process. One of the surprising things is how very many water mills there were in Scotland just over a century ago – at least 4,100 water mills in the 1890s-1900s. Over half of these water mills are also not recorded in the National Monuments Record for Scotland, showing the value of detailed research on historic maps to recover knowledge about our industrial heritage.
The Water to Steam project is based on testing a hypothesis promoted by Andreas Malm in his book Fossil Capital: The Rise of Steam Power and the Roots of Global Warming (2016), which is that the transition from water to steam power in northern England largely reflected the introduction of capitalist production processes and social relations. It was not primarily driven by resource scarcity or changes in the scale of production, so much as driven by mill owners to achieve higher profits through greater control over labour. One of Malm’s conclusions is that if we want to understand contemporary climate change, we need to understand the social and economic drivers behind it in an historical context, and that ‘market forces’, by themselves, are unlikely to provide the answer as they are part of the problem.
If we look at historic and contemporary maps showing the sites of water mills, many of these are very practical, and could easily re-utilise a free source of energy in powering machinery. But in order to promote their re-introduction or wider use, there would need to be a radical change in economic thought and social practice. It is possible to take an optimistic view towards this if one sees the opportunity for radical change in these ideologies.
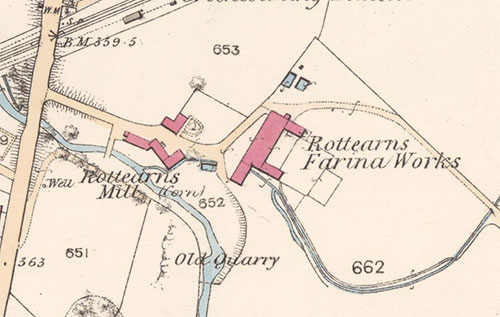
Map detail showing Rottearns water-powered Farina Works and Mill, Strath Allan, Perthshire, in 1863.
Is the National Library of Scotland undertaking any other projects or initiatives to help combat climate change?
Chris: The forthcoming COP26 Climate Conference has encouraged a range of related activities, included the development of a Climate Change Action Plan, as well as various initiatives related to the collections encouraged by a Climate Crisis intern.
Louise: The Library has a large number of upcoming projects to help combat climate change. We have worked closely with our Climate Change intern Henry Roberts to develop a Climate Action Plan. This plan aims to look at how the Library can tackle Climate Change and how we can help the public look into Climate Change.
Some of the projects that I am particularly looking forward to include Living Proof (a compilation of footage from the Moving Image Archive – see page 6 of this Summer’s Discover or click here for more information) and the soon-to-come Environmental Data on the Data Foundry.
What does your work with Map Collection tell us about how libraries can contribute to climate action?
Louise: Libraries hold a wealth of information that is useful for climate change research; using this information can provide useful visual tools for communicating with different audiences. They can be used to spread awareness and provide education, or to support campaigns. We plan to digitalise 30% percent of our collections by 2025 and our online collections are constantly growing. I think making information available is really important to contribute towards climate action. This is something that libraries do really well.
Learning from our readers is another important way to find ways to contribute towards climate action. We learn what interests them, what is important to them and what they would like to see. They can help us see things in a different way and help us find better ways to provide climate change information.
We are always happy to answer questions about our collections too. Anyone can get in touch by emailing maps@nls.uk.
Thank you so much to Chris and Louise for sharing these reflections on the outstanding work that the National Library of Scotland is doing to communicate the impact of the climate crisis to readers, inspiring them to make use of the Library’s rich and dynamic collections to enhance their environmental awareness.
For more information, please visit ‘Researching climate change with our maps collection’ on the National Library of Scotland website.